
A Special Rankandfile.ca Report
In less than 10 years, the Ontario’s Workplace Safety Insurance Board went from an alleged “unfunded liability crisis” threatening the very existence of the compensation system, to a surplus in which employer premiums have been slashed and corporations gifted billions of dollars. Rankandfile.ca presents this Special Report by Chris Grawey, a researcher and legal representative for injured workers at the Injured Workers Community Legal Clinic (IWC) and Bonnie Heath, chair of the IWC Board of Directors.
Contents
- Introduction
- Section 1: How it was created and how it has changed
- Brief background on Workers’ Compensation in Ontario
- The Harris Years: The First Unfunded Liability Crisis
- The Second Unfunded Liability Crisis
- The Marshall Years: Austerity for injured workers
- Section 2: Austerity measures
- Loss of Employment Benefits
- Deemed Out-of-Benefits
- Non-Economic Loss Awards
- Section 3: Claims, appeals and systemic problems
- Fewer claims and acceptance rates
- More appeal denials by Appeals Resolution Officers
- Systemic issues before and during the Marshall Years
- Conclusion
- Chronic under-compensation for injured workers
- Billions transferred to Big Business
Introduction
The corporate lobby is misleading the public when it suggests that the Workplace Safety and Insurance Board (WSIB) is over-funded and that the money should be “returned” to business. Why? Because injured workers’ have been under-compensated by the WSIB in the billions of dollars.
When “times are tough” at the WSIB, it is on the literal and figurative backs of injured and ill workers that the Board restores its financial health. Then, when the WSIB is flush with cash, in part because of austerity for injured and ill workers, the provincial government decides that instead of properly compensating the people for whom the system is built, it will direct any surplus into the pockets of big corporations and the business class.
Right now in Ontario, the Progressive Conservative (PC) government has allowed the WSIB’s recent surplus to become a slush fund to reward their business class backers, to the detriment of injured and ill workers.
Section 1: How it was created and how it has changed
Brief background on Workers’ Compensation in Ontario
Workers’ Compensation was established over a hundred years ago in Ontario. The system is premised on a historic compromise: no fault compensation and the provision of benefits for as long as the disability lasts. In return, workers generally lose their right to sue their employer for a workplace injury or illness.
Today, injured workers are entitled to Loss of Earnings (LOE) benefits at a rate of 85% of net pay. Health care assessments, treatments, and medications can be covered by the WSIB for a work-related injury.
If an injured worker has a permanent injury, they may be entitled to a lump sum Non-Economic Loss (NEL) award. After one year of injury, the WSIB contributes a mandatory 5% of the workers’ wage-loss benefits to a Loss of Retirement Income fund (LORI), paid out as a lump sum at age 65.
Worker’s can also voluntarily contribute 5% of their bi-weekly earnings to this fund. The WSIB also provides Return-to-Work Services (RTW) that may include, training, skills upgrading, and job search assistance.
WSIB is not a taxpayer-funded system. It is funded by employer premiums, investment income, and administrative fines and penalties levied by the Board. However, when WSIB denies, terminates or reduces benefits, some injured and ill workers must turn to taxpayer-funded social programs, such as Ontario Works (OW) and the Ontario Disability Support Program (ODSP).
Workers’ Compensation was never intended to operate on a traditional for-profit insurance model. Rather, the intent behind the legislation was more akin to a social program. Nevertheless, since the 1980s, there has been a creeping tendency to adopt more insurance-based adjudication, policies, and practices. The name change from Workers’ Compensation Board (WCB) to the Workplace Safety Insurance Board in 1997 best symbolizes this transformation.
The Harris Years: The First Unfunded Liability Crisis
During the early-to-mid 1990s, the workers’ compensation system was allegedly heading towards financial collapse due to rising unfunded liability. The term “allegedly” is used because the Board has faced an unfunded liability since its inception. The unfunded liability is defined as the shortfall between the money needed to pay all current and future benefits and the money in the Board’s insurance fund. While carrying unfunded liability, the workers’ compensation system has survived the two world wars, the Great Depression, the 1970s oil shock and stagflation, the 1987 Stock Market Crash and subsequent recession, the Great Recession, and the COVID-19 Pandemic.
Private insurance companies are required by law to have enough funds to cover all of their future commitments in case they go out of business. This requirement is not necessary for a social program like workers’ compensation because participation is mandatory and it faces no competition that could drive it out of business.
In the late 1990s, under the guise of a “financial crisis”, the provincial government of Premier Mike Harris implemented unprecedented austerity at the expense of injured and ill workers. On January 1, 1998, the government reduced the Loss of Earnings (LOE) benefits rate from 90% to 85% and the WSIB’s contribution to the paltry Loss of Retirement Income (LORI) from 10% to 5%. The government also reduced the annual cost-of-living adjustment, resulting in less money in workers’ pockets.
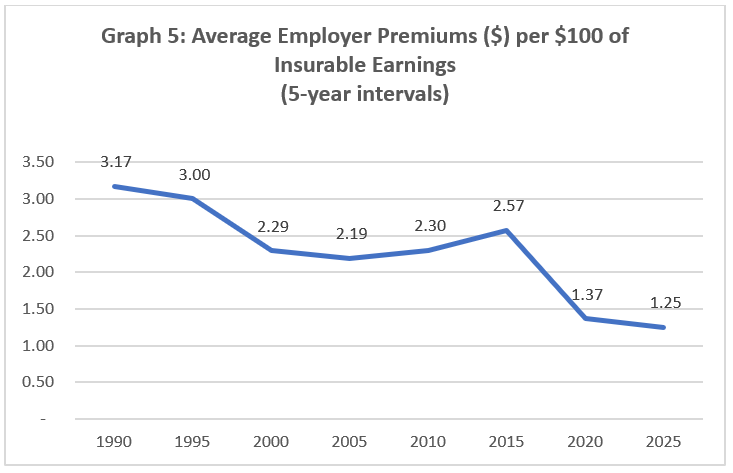
While injured workers faced cutbacks under this so-called unfunded liability crisis, the average employer premium rate per $100 of insurable earnings was reduced from $3.00 to $2.59, a 14% drop. During the remainder of PC rule, premium rates per $100 of insurable earnings were reduced another 15%.
If there was an unfunded liability crisis, why were premium rates for employers reduced by close to 30% during this period? Ultimately, the 1990s unfunded liability crisis was a dress rehearsal for the unfunded liability crisis of the 2000s.
The Second Unfunded Liability Crisis
From 2006 to 2008, the WSIB’s sufficiency ratio that measures the unfunded liability, dropped from 73.2% to 53.5%, largely a consequence of the Great Recession. In 2008, the WSIB’s gross investment return declined by 15.5%, amounting to a $1.3 billion loss. By 2009, these conditions prompted the Auditor General to highlight the unfunded liability as a problem in need of a solution. As a result, David Marshall was appointed as President and CEO of the WSIB in 2010 to tackle the Board’s unfunded liability. To the injured worker community, this period became known as the “Marshall Years”.
Naturally, the ideological views of the Board led to the creation of a narrative that turned reality upside down. It presented the primary issue at the WSIB an expense problem (i.e., injured worker compensation too high), not a revenue problem (i.e., lowered average premium rates and investment risks).
Unlike the Harris years, average premium rates per $100 of insurable earnings increased. From 2006 ($2.26) to the 2016 peak ($2.59), average premium rates increased about 1.3% per year. Notably, those increases were below the rate of inflation for most years. And when premium rates peaked in 2016, they were still far below the rate from virtually all of the 1990s.
Ultimately, the unfunded liability was completely eliminated in the 2017/2018 period, years ahead of schedule. While there are multiple reasons why it was eliminated (e.g., increase in investment revenues), it is clear that a primary reason for the elimination of the unfunded liability was based off cutbacks for injured workers.
The Marshall Years: Austerity for injured workers
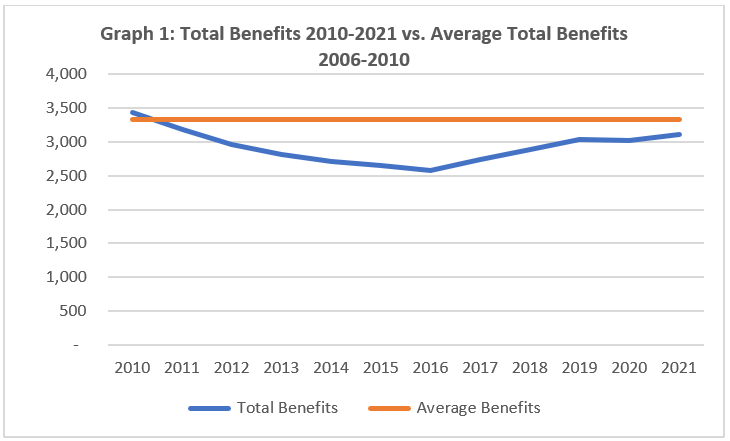
Data received from 2006 to 2021 via a Freedom of Information request reveals a substantial reduction in total benefits paid out to injured workers during the Marshall Years. Total benefits paid out were more than $3.542 billion in 2009, the year before Marshall’s hire, compared to $2.584 billion in 2016. This is an annual difference of nearly $1 billion and a 27% decline.
The average annual benefits paid out to injured workers from 2006 to 2010 was approximately $3.333 billion. When the average annual benefits paid out from those years is projected on each year from 2011 to 2021 and compared to the actual benefits paid out to injured workers each of those years, it reveals that injured workers were under-compensated in this decade by about $4.945 billion.
Perhaps variations in the employment rate to explain these changes: fewer people employed could account for fewer claims. However, employment data from Statistics Canada shows the total number of employees in Ontario grew steadily except during 2009 (Great Recession) and 2020 (COVID). In fact, the amount of money for benefits paid peaked as the employment rate dipped after the Great Recession in 2009.
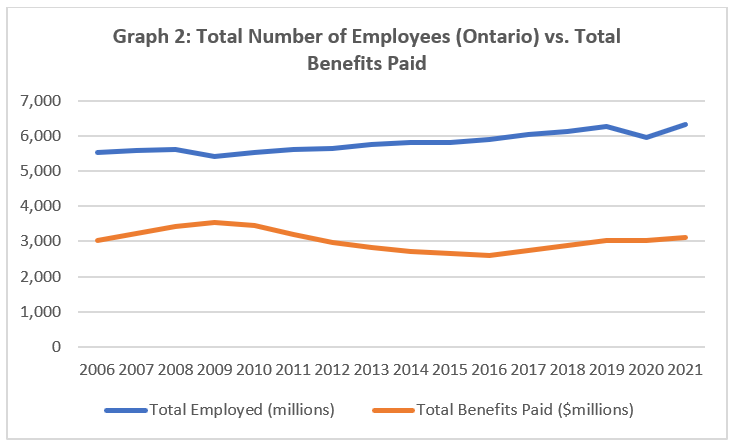
Or maybe, workplaces actually became safer during the period that the unfunded liability was retired. For example, fewer claims meant less money paid in benefits. However, the number of claims and the amount of money paid in benefits mysteriously rises back up to 2006 levels after the unfunded liability was no more. The more plausible explanation lies in adjudication practices that determine how much compensation injured and ill workers receive.

Section 2: How workers are getting screwed
Loss of Employment (LOE) Benefits
When someone gets injured at work, they are never made whole, as the WSIB’s rate for wage-loss is 85% of net pay. That amounts to a 15% pay cut. For permanently injured workers unable to work, the cumulative loss over years is often devastating and far-reaching. On top of the wage loss, injured workers lose out on their workplace benefits plans after one year of injury and they have fewer pension contributions made when they reach retirement age.
Seven provinces in Canada have LOE rates of 90%. As stated, Ontario’s rate was 90% until the PC government of Mike Harris reduced it to 85% in 1998. The current PC government of Doug Ford announced during a previous election campaign that they would explore the possibility of increasing the rate back to 90%. However, that has never been fulfilled.
While a 5% difference may seem insignificant at first glance, when you have hundreds of thousands of people receiving LOE benefits every year, the 5% figure is truly staggering over time. From 2006-2024, we estimate that the 85% LOE rate shortchanged injured workers by approximately $1.155 billion. This number was determined by calculating 5% of the total LOE paid out during those years. This estimate is conservative, as it does not include compounding from annual cost-of-living-adjustments.
With respect to the unfunded liability crisis, the average annual LOE payouts to injured workers declined in those years. Schedule 1 (collective pool liability employers) LOE benefits peaked in 2009 at $1.149 billion and bottomed-out at $839 million in 2015. As of 2024, Schedule 1 LOE benefits only reached $1.108 billion, $40 million less than in 2009.
Deemed Out-of Benefits
Out of the hundreds of policies and practices at the WSIB, deeming is the most hated and predatory for injured workers. Simply put, deeming is a way to reduce or eliminate an injured workers’ benefits, by “deeming” them to be receiving the wages from a pretend job that they do not actually have.
For instance, if a minimum wage grocery store worker gets injured and cannot return to the job, the WSIB can “deem” the injured worker for a type of job that the Board finds suitable, such as a minimum wage customer service representative. Because the wages for the pre-injury job and the “deemed” suitable job are the same in this example, the injured worker would lose 100% of their LOE benefits even though they are not actually employed in the position.
This practice has led to significant consequences for injured workers, ranging from the loss of homes and the breakdowns of families, to substance abuse problems and a shorter life expectancy. It is often in these circumstances that injured workers have to rely on the inadequate OW and ODSP systems to survive.
According to WSIB data, there were 29,010 workers deemed between 2002 and 2021, with the number of deemed workers peaking at 2,942 in 2010, the year of Marshall’s hire. If we use $20,000 as the average salary per deemed worker, then we can estimate that injured workers were under-compensated by more than $580 million during this period. With that being said, that estimate is likely a conservative one, as many injured workers are deemed for multiple years and lose out on more than one year’s worth of income.
Non-Economic Loss Awards
The workers’ compensation system does not provide damages for pain and suffering. As such, there is no ambulance chasing as in personal injury law. The closest entitlement at the WSIB would be the lump-sum Non-Economic Loss (NEL) award, which is issued for permanent physical and/or psychological injuries. Injured and ill workers in receipt of NEL awards often feel insulted and cheated because the award amount is so low. Time after time, injured workers explain that in no way does the award reflect the negative impact the injuries have inflicted on their livelihoods and their personal lives.
The total annual value of Schedule 1 NEL awards peaked in 2008 – the year prior to the unfunded liability crisis – at $129.4 million. By 2011, NEL payouts dropped to $87.7 million, and by 2016, NEL payouts dropped to $40.1 million, less than one third of the peak. In 2021, years after the unfunded liability crisis concluded, the total annual NEL payouts amounted to $65.6 million, just over half the 2008 peak.
If we look at the number of annual NEL awards issued, there was a significant drop during the unfunded liability crisis. For example, from 2008 to 2010, there were between 18,521 and 19,490 NEL awards issued to injured workers per year. However, by 2011, the number of NEL awards dropped to 13,800, a decline of nearly 5,000. And by 2016, the number of NEL awards issued were a measly 9,120, less than half the peak.

The average annual Schedule 1 NEL payouts from 2006-2010 was $123.86 million. When the average annual NEL payouts from those years is projected on each year from 2011 to 2021 and compared to the actual NEL awards paid out to injured workers each of those years, it reveals that injured workers were under-compensated by approximately $750 million.
These cutbacks didn’t happen in a vacuum. They can only be understood in a context of conservative adjudication (increasing denial rate) and no adjudication (fewer claims reviewed for permanent injuries and NEL awards).
Section 3: Claims, appeals and systemic problems
Fewer claims and acceptance rates
Through WSIB data, we can analyze the trends for accepted and denied claims over the long haul. The numbers referenced here include only claims for which a claim was accepted or denied; therefore, pending and abandoned claims are excluded (if pending and abandoned claims were included the acceptance rate would be much lower).
From 1993 to 2007, the acceptance rate for claims ranged between 94.02% and 96.04%, about a 2% difference. These rates were quite consistent over 15 years. However, beginning in 2008, the allowance rate started to drop rapidly. In 2008, the rate dropped to 93.5%, and by the next year, to 92.42%. The allowance rate bottomed out at 87.26% in 2015, before gradually increasing since then, but still not to previous levels seen prior to the Marshall Years.
These trends suggest that during the unfounded liability crisis, initial adjudication became more conservative, likely the result of a chilling effect due to the rising concerns about the Board’s financial health. As a result, thousands of injured workers were left out in the cold.
More appeal denials by Appeals Resolution Officers
Injured workers can appeal their claims to an Appeals Resolution Officer. This is an internal WSIB process, not to be confused with the Workplace Safety and Insurance Appeals Tribunal. The earliest data provided by the WSIB for Appeals Resolution Officer decision outcomes is from 2000, when 52% of appeals were denied. The denial rate crept up for the next few years before skyrocketing to a peak of 68% in 2015, 2017, and 2018. In just over a decade, the appeal denial rate increased by more than 30%.
A primary reason for the growth in denied appeals during the Marshall Years was related to concerns with the unfunded liability, similar to the trend at initial adjudication. As we saw above, more claims were getting denied at the outset, so it stands to reason that this trend would be reflected in the appeals system, too.
As a result of the WSIB’s ugly bureaucratic system, many workers simply gave up appealing a denied claim or a denied appeal decision at the Board because of the physical and psychological toll it would take on their lives. This is a system built by design, and it is not designed for injured workers.
Systemic issues before and during the Marshall Years
Other systemic issues which contribute to the under-compensating of injured workers, include:
1. Discriminatory age cut off provisions for older injured workers. The law states that an injured workers’ LOE benefits terminate at age 65. If the injury occurs when the worker is 63 years of age or older, LOE benefits terminate after two years. Simply put, this is age discrimination. Alberta and British Columbia have adopted provisions in their legislation so workers can continue to receive LOE benefits beyond the limits imposed by their respective laws. Ontario should follow suit.
2. Chronic under-reporting and the high denial rate for costly long latency occupational disease claims.
In 2019, the PC government appointed Dr. Paul Demers to review the work-relatedness of cancer. Dr. Demers’ report estimates that approximately 3,000 Ontarians are diagnosed with work-related cancer each year; however, only 400 cancer claims are submitted and only 170 are accepted by the WSIB.
3. High denial rates for traumatic mental stress and chronic mental stress. Only about 10% are allowed.
4. Denying or limiting entitlement based off pre-existing conditions.
5. Not listening to treating doctors and using the Board’s hired gun doctors to make decisions that deny the work-relatedness of injuries.
6. The WSIB’s “Better at Work” ideology that forces workers to return to the workplace prematurely, leading to the worsening of injuries and the development of secondary injuries.
7. Claim suppression committed by employers (carrot and/or stick) and by the WSIB not conducting proper follow-up with injured workers.
CONCLUSION
Chronic under-compensation for injured workers
The approximate dollar figure revealing the under-compensation for injured workers at the WSIB is not yet known due to limited data provided by the Board. Nor is that information easily quantifiable. Yet, with the data we do have, we can reasonably speculate that injured workers have been under-compensated in the billions of dollars due to government legislation, ideological policies, and adjudication practices at the WSIB.
As injured workers have been under-compensated, successive governments and the WSIB have opened the financial floodgates to employers. The average premium rate per $100 of insurable earnings declined from $3.17 in 1990 to $1.23 in 2026.
Billions transferred to Big Business
This trend intensified under Premier Doug Ford’s PC government, first elected in 2018. Average premium rates per $100 of insurable earnings declined from $2.35 to $1.23 in less than 10 years. According to a November 2024 government press release: “Over the past decade, the WSIB has cut the average premium rate by more than 50 per cent, resulting in cumulative savings for businesses of approximately $18.6 billion since 2017.” Premium rates are said to be at the lowest level in 50 years.
“Over the past decade, the WSIB has cut the average premium rate by more than 50 per cent, resulting in cumulative savings for businesses of approximately $18.6 billion since 2017.”
In addition, the government has announced several multi-billion-dollar giveaways to business as a result of the “WSIB’s strong financial position” — or what should more appropriately be called the “WSIB’s under-compensation of injured workers”.
The PC government announced $2 billion in rebates for business in November 2024. Shortly after, in April 2025, the government announced they would provide another $2 billion round of rebates in response to uncertainty created by Trump’s tariffs. Unsurprisingly, a third round of $2 billion rebates was announced in September 2025 to help business combat “economic uncertainty.” Cumulative savings for business now exceed well over $20 billion. Robbing Peter to pay Paul is an apt way to describe what’s going on at the WSIB.
What’s most troubling about these rebates is how the government and the WSIB is using the so-called surplus to prop up business during a time of tariffs and economic uncertainty, which has nothing to do with the WSIB’s mandate of providing compensation to injured and ill workers. This has established a dangerous precedent whereby governments plunder the workers’ compensation system for political purposes and enriching the business class and multinational corporations.
The WSIB is underfunded and under-compensates injured workers. The so-called surplus exists as a result of laws, policies, and decisions which have now led to an unprecedented transfer of wealth from injured workers to big business. WSIB has become has become another example of the income and wealth disparities endemic to Canadian capitalism.
“Historic compromise” is a government speak designed to minimize the rights of injured workers. In fact it was an exchange of the absolute right to access justice for the 5 Meredith Principles.
The “unfunded liability” never existed, the auditor imported a private insurance principle into the monopolistic social program. BTW the solution to this non-existent myth was to raise assessments not slash benefits by 10%.
Bill 169 imposed age limits where none existed and without demonstrable justification, Bill 15 enshrined the Boards powers with the MOL and Bill 99 removed any and all remaining rights of injured workers and made them the last consideration of the system created to protect them.